Thursday, March 29, 2012

Using a resource for a different concept

Demitra's school has a copy of the resource "Puddle Questions:  Assessing Mathematical Thinking."  In it there is a question about how you would measure a puddle.  Demitra decided to modify the question to meet her needs for assessing what the students know about area.  She also wanted them to self-reflect on their work and she wanted to be able to give them some descriptive feedback on what they could do better.  Sounds like a tall order, but when it fit together nicely and the students really got a lot out of the lesson.


Minds-On:  Each group was given a large triangle made out of construction paper.  They were asked how they could find out the area of it.  They then set to work discussing and trying different ways.  What was great was that each group came up with a different way, and they all knew that the units that they used must all be the same.

Action:  After being given the task, Demitra reviewed the success criteria that had been co-created together.  The students gave examples of what the criteria might look like in terms of the task.  For the actual task, the students were asked to draw a puddle and find the area of it.  They could use any way they wanted to.  Some students drew lines, others used cubes, pentominoes, finger spaces, and some even drew shapes that they thought would be "easy" to count.

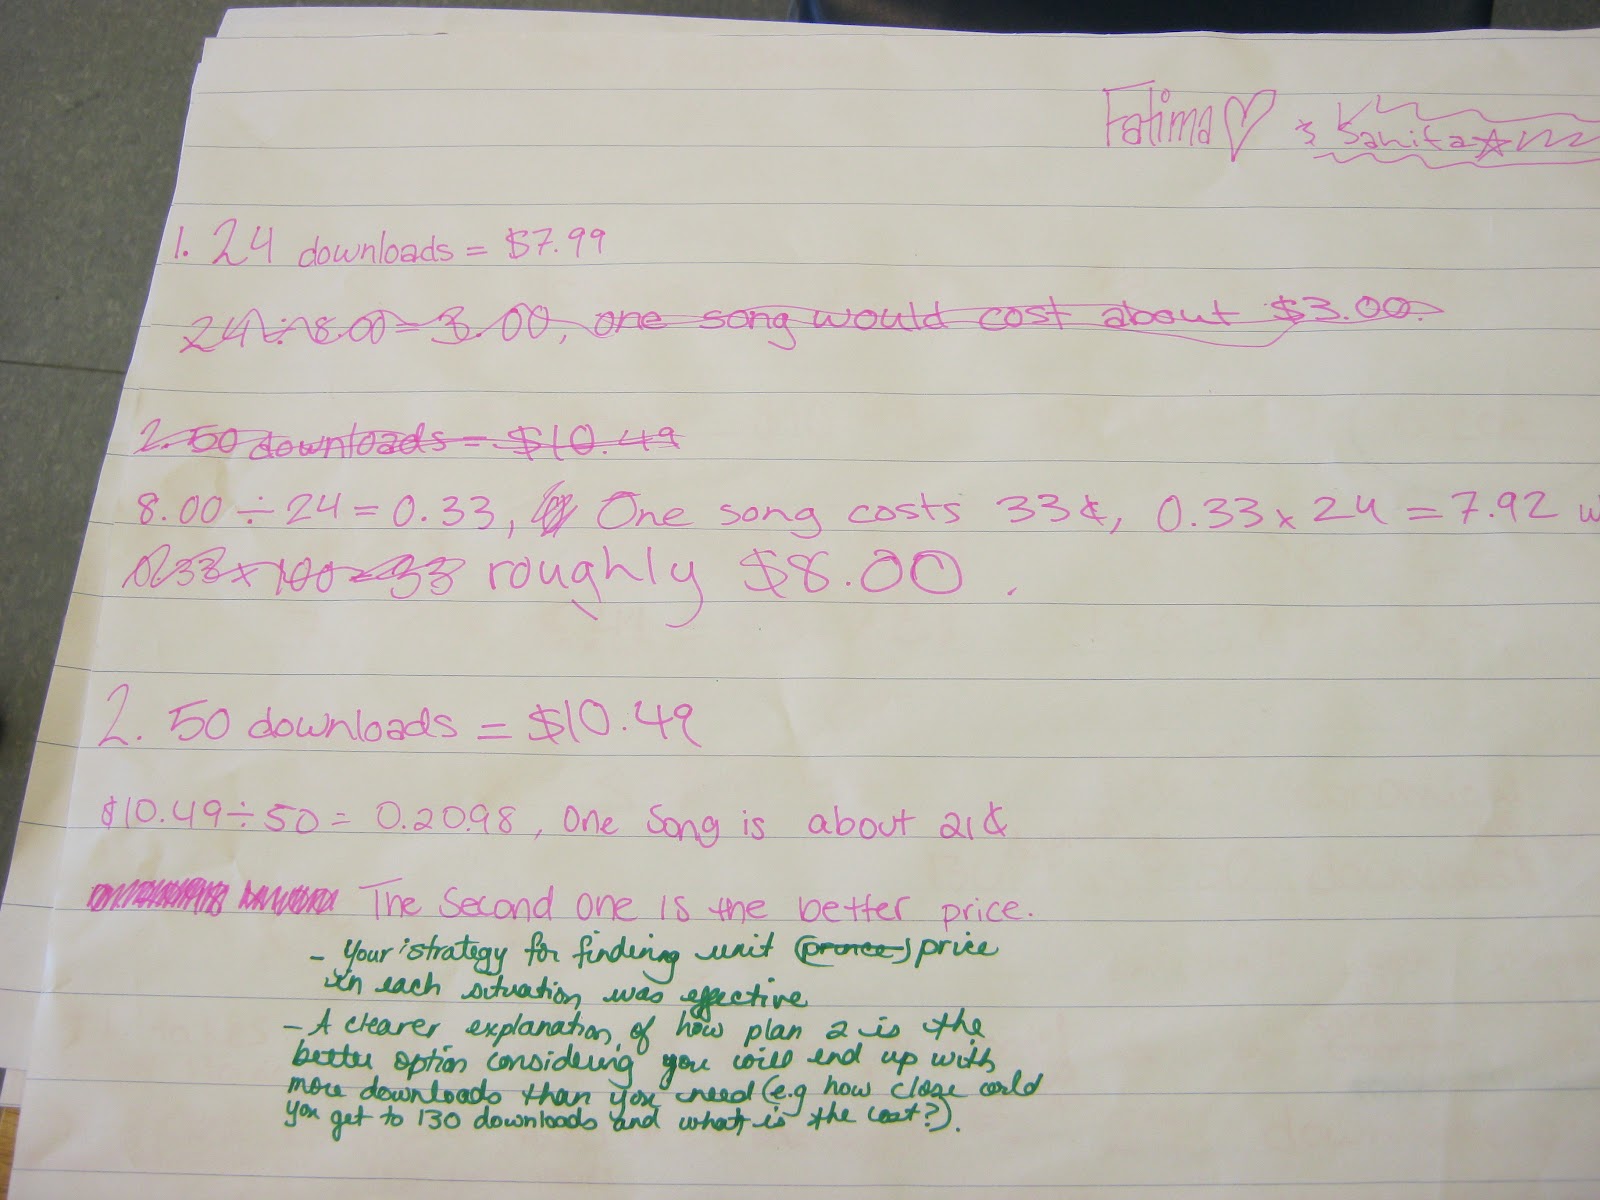
Consolidation:  Demitra had one-on-one conferences with each of the students to not only assign them a mark (based on the four categories in the achievement chart) but also to give them some feedback on what they had done well on, and what they could improve upon

When this student brought his work up, he came up ready to chat about why he thought he needed to make a smaller puddle.  He said it was because a smaller puddle would have a smaller area and that would be faster to count than the puddle he had drawn.  He also said that he would have used a bigger unit to measure the area with and this would also cut down on the number of units he had to use.  This is why his feedback was to think about how he could have shared his oral knowledge in a written way.
This student used a K-W-C chart to help them make sense of what they had done.  You can see there was a bit of a thinking error in their work as they used pentominoes to answer the question, but when they couldn't successfully draw them onto their puddle, they jumped to just drawing lines on the shape they had traced.  When probed, this student was unable to share why it was important that all tools they used to find the area needed to be the same size.

This lesson left Demitra feeling pretty confident in her student's abilities to find the area of a shape.  The one-on-one conferences also helped her ask some deeper questions to help determine the students knowledge and understanding of area and how well they were able to apply that knowledge and understanding to the problem at hand.

Learning To Add

Part of the Grade 2 number sense and numeration expectations are around being able to add and subtract numbers using a variety of strategies.  Steve's class has been working on using mental math as a strategy and he wanted to see what other strategies the students were using to help them add numbers together.

His lesson started off with a minds-on activity where the students had to talk about how they would go about adding three numbers together.  He did a think-pair-share activity where the students had to tell their partner how they would add the numbers together.  To help tie in a little more accountable talk, the students were then asked to share what their partners' strategy for solving the equation was.  "John" was asked why it was okay for his partner to move the 3 around in the addition sentence.  He told the class that because it is addition, it doesn't matter what order you add them in.  This thinking was recorded on the board to help with the upcoming problem.  Here are some of their strategies:


The students were given the following problem for their action part of the lesson: 

I went to the store and bought some stickers.  One pack had 14 stickers, one had 7 stickers and the last pack had 16 stickers.  Did I buy enough to give everyone in the class a sticker?

Working in pairs, the students quickly went to work adding the number together using different strategies.  What was interesting is that most of the students were successful in solving the problem, but didn't actually answer the question with a final sentence.  For some students they realized that the number they got was different than the number of students in the class, (the number of stickers purchased was higher than the number in the class) and they said that he didn't buy enough.  This was talked about with the whole class during the consolidation of the lesson.

For consolidation, the student's work was grouped together in a bansho to highlight the strategies that they used.  In total, the class showed 5 different ways of adding.


Pictures, Tally Marks and Tally Marks in groups of 10 (this was highlighted to get the students to think about groups of rather than just making groups of 5)
Adding by 1s and 10s is the "traditional" was of adding, and the final way was Using friendly numbers

For the group that used friendly numbers, they were prompted by the teacher in helping to explain their thinking.  Orally they were able to communicate what they had done, but were not quite able to record it on paper.  So when they became "stuck" the teacher recorded their thinking in pen for them and then they carried on from there.

As an "exit ticket" out of the lesson, the students were asked what strategy they would try next time they did addition.  What was great was that the students were keen to say "I used strategy x, and next time I want to try strategy y because..."  This shows that they are reflecting on their learning, and hoping to expand their addition tool kit.

Surface Area....Trying It Out

Anthoula was part of our Grade 6 lesson study a few weeks ago and she really liked the activity that she saw.  She had set a personal goal for herself of trying to do more small group problem solving, and thought that the lesson she saw in Brian's class would be a great place to start.

For her minds on, she had the students brainstorm a definition of what surface area is.  Then they co-created a list of steps to take in order to successfully find out the surface area of any shape.


For the action, the class was divided into small groups based on their abilities.  Each group was given a box and the students were each assigned a task to do based on the box.  The tasks were:  create a net, justify what polygons are in the figure, find the area of each face and finally find the surface area of the box.  They then had to give an example of when they would need to use surface area.  The students were reminded to refer to the success criteria that is being created when working on their activity.


Here are some samples of the students work.


To consolidate the lesson, Anthoula offered each group descriptive feedback on what was done well, and what could be changed to help make their answer better.  For some students, she even allowed them the opportunity to reflect on what they could have added (based on the success criteria) to make their answer stronger.

Tuesday, March 27, 2012

Modified, But Marvelous!

Mary attended the FOS PLC's for Grade 2.  She is currently teaching a SERT program with students who are at different grade levels and different learning styles.  She took one of the measurement lessons that we did together and modified it to meet the needs of her classroom.

She had done some previous lessons with her students on what distance is.  They co-created an anchor chart that is hung up in the classroom.  You can see how the chart is written in simple language, uses colours and also uses pictures to help students.  It is a really good example of how you can use the students in the chart (and to help you make the chart) to make them more engaged in the learning.


For the minds-on of the lesson the students created paper airplanes.  For the action, the students predicted how far they thought their airplane would fly.  Mary used the tiles in the hallway as the non-standard unit of measure as there were many of them, and the students could count them easily. After each flight, the students then wrote down the actual distance that their airplane went.  They then repeated this two more times.  As each student was having a turn, they came up with different ways that they could count the tiles.  Some counted by 1s, some by 2s, and some by 5s.  Regardless of how they chose to count, they all came up with the same answer.  Here is the recording sheet that they used to record their information:


For the consolidation the students came together on the carpet to share their results and answer questions about the data that they had in front of them. What is great about this lesson is that although the students were measuring using non-standard units, they also got the chance to use skills from other strands like Number Sense and Numeration (for skip counting) and also a bit of Data Management as they talked about the data they had collected, and made inferences about what they saw.  Their learning was recorded on a chart:


The students also talked more about the unit that they used to measure with by justifying why they thought the tiles were a good unit to measure with and also listed other things they could use to measure distance.

It was a great lesson that Mary modified to meet the needs of her students, but could easily be done in any given classroom.

Linking It To Other Things

Raven's Grade 5/6 class recently went to see the movie The Lorax.  He decided to use some of the schema the students had about the movie and tie it into a measurement problem for his students to do.  Here is the problem he gave them:


The question brought up a lot of good discussion points with his class.  They each worked in groups to complete the work.  When they were done, the work was placed on the blackboard and the students engaged in a congress to talk about what they had done, and what they noticed.  The students engaged in some rich talk about where exactly the trees would be located, and if there was an easier way to help them find out how many they would plant.  There was talk about how the model that is drawn may not actually represent the math that was happening on the page.  This is a great discussion to have as many students get confused when it comes to area and perimeter.  I've found that sometimes when using the geoboards to help find area and perimeter students don't always count the pegs correctly, and therefore come up with an incorrect answer because of the strategy that they used.


When they were done their discussion, Raven created a highlights chart with some of their thinking.  The students can use this chart to help them as they progress through the unit:

This is a great example of how a topic that the students are interested in, or learning about in other subject areas can be used to create problems to solve with your students.

Getting Creative With Learning Goals

Raven teaches a combined Grade 5/6 class.  Here is a great way that he got the students to not only understand what the learning goals for the unit on measurement were, but to make it creative and fun.


You can see that some of them are specific to a grade (e.g., Grade 5 or Grade 6) and others are geared towards both grades.  Since most of the measurement unit is about measuring two- and three- dimensional shapes, they used those as the backdrop for the learning goal. 

Its a simple idea, but one that not only engages the students, but will get them thinking about their learning in a positive way.

Same Lesson, Different Consolidation

Doug was part of our lesson study a few weeks ago when we were in Sarika's class.  He is just starting to work on area and perimeter with his Grade 5 class and wanted to use the lesson that he saw to help him gauge where his students are at in terms of their knowledge of the topic.

He started with the same minds on - a discussion about area and perimeter.  He had his class come up with a working definition of what area and perimeter are.  Instead of writing out the definitions for each, he put the words that the students used under each heading:

For his action, the students then completed the problem.  Doug changed the name to reflect the name of the environment club at the school.


As a consolidation, Doug wanted to work with the students on using the success criteria to help them with their answer.  As the students shared the success criteria was referred to over and over again (for both the good things that they had included, and the things that were missing).  The work was sorted into several groups:

This first group all used size words as their justification of their choice.


This next group used the word "equal" and then were able to talk out what they meant by "equal" and how their knowledge could have been written more clearly on the page:

The black writing is what came out of them as they were discussing.
The next group started to use measurement words like area and perimeter in their answer.  You can see that when they were sharing their answer, one group told us how they got the perimeter and it was recorded in black as they spoke.


The last group used multiplication as a way to find the different area of each shape.  However, they did not write out the formula for area.  BUT, since this lesson was at the very beginning of the unit they have not yet formally learned the formula for area (that is a goal to have achieved by the end of Grade 5).  Knowing that you could get the area by multiplying is a huge "a-ha" moment for students, and will help them as they progress through the grades.


As the "exit" out of the lesson, the class was asked to think about what our discussion was during our consolidation, and share one thing that they would do differently next time.  What was interesting is that several students not only shared a very important thing they would do differently (e.g, use more math words like "area") but also highlighted how that what they would do differently was in the success criteria (e.g., The last group said that they would be sure to use the formula for area, just like what is in the success criteria).

Remember...You don't have to re-invent the wheel when teaching.  Ask a colleague for ideas on what you could do, and you might be surprised at how it turns out.

Tuesday, March 6, 2012

Time Goes By So Quickly

Kristen decided to begin her unit on Measurement by starting with teaching them time.  Since there are only a few days before March Break she figured it was something that could be easily covered, and would not be hindered by the week off school.  This was her second lesson on elapsed time.  It was part of our FOS PLCs.  Therefore we did the lesson as a lesson study.

The minds on was giving the students a problem about finishing chores in time to watch a favourite t.v. program.  The students did a think-pair-share and also used the accountable talk strategy of repeating (in their own words) a strategy of someone else.  Here were three answers that were given:


Kristen then gave the students the problem.  It was taken from the curriculum document. 
They were reminded to check the Success Criteria before and after they started to make sure they were not missing any important pieces in their final answer.

Just before the consolidation, the teachers came together and decided what groups should present their work during the congress.  Three groups were chosen because they had done different strategies that were interesting and unique.  Some of the groups even tried to show their answer in more than one way just to see if they could. 

The teachers then left the classroom and headed back to the staff room to debrief.  They talked about making the action more of a parallel task where the students could chose between this problem and one that used slightly different numbers (e.g., ones that ended in 7, or 6) to allow for some DI for the class.  The group also talked about what some next steps could be for the class in the upcoming days to either help them build upon the concept of elapsed time, or to do as a culminating task.

The group broke into smaller groups to give some descriptive feedback to the students.  Here are some of their comments:


A Bansho was then created with all of the student work to showcase the different strategies that were used to solve the problem.  The group had some really rich conversations about the strategies and when to push students to try new strategies, and when to let them keep using a specific strategy.  Even in grouping the work for the Bansho, some of the work samples we felt could still be moved around and new groups could be formed, or bigger groups could be made.  Here are pictures of the finished Bansho and also of the specific groupings.

Strategy: Using words
Strategy:  Adding the times together.
Strategy:  Adding, but converting the units from minutes to hours and minutes.
Strategy:  Using a number line.

Strategy:  Writing out the time that each activity was finished in a "number line" type fashion.  These two pieces caused quite  a discussion in the group as we were not quite 100% sure where to put them...Are they just like a number line?  Are they something more?  Something less?
It was a great professional afternoon full of ideas, discussions, and rich learning for both the students and the teachers.  I highly recommend you take the opportunity to visit a demonstration classroom and be apart of a lesson study.  If you need help in finding one, please let me know and I will see what I can do.

Monday, March 5, 2012

Structural Safety

Peter wanted to do a lesson that he had done previously with the family of schools during a transitions workshop.  He made a few modifications to the question, and then decided to give it to his class as part of a final assessment for his measurement strand.

His three part lesson went as follows:

Minds on:  The students talked about what they would need to rebuild a building after it had been knocked down. 

Action:  The students worked on a problem that asked them to pick which support structure they should choose and why.  They were given a choice of a cylinder, a triangular prism, and a rectangular prism.

Consolidation:  As a class, the students talked about the "Pros" and "Cons" of using each shape.  This was recorded on the chart below.


The teachers in the group then headed back to the debrief room to debrief the lesson, and also do a bit of moderated marking.  Using the achievement chart as their guide they marked several piece of student work and gave some feedback to the students.  The discussions were really rich and really centered around why a mark would or would not be awarded.  Here is some of the student work, and how it was assessed:


Part 1 of the student "a"'s work
Part 2 of student "a"'s work.
Part 1 of student "b"'s work.
Part 2 of student "b"'s work.

The Rate of Things

Heather opened up her Grade 8 class to the PLC group for a great intro lesson on rate.  Her class has been looking at rate and ratio a little bit during their science class, but before she proceeded into the unit she decided to do a diagnostic lesson on what they already knew.  She started off with the following question as her minds on:

At first the discussion was going only based on observations about the numbers.  Then Heather moved the conversation into more about unit rates.  The students were able to share ideas freely, and as you can see in the picture made a mistake along the way, but quickly corrected themselves.  This was important to them so they could work on using justification skills and think about what makes sense.

For the action part of the lesson, she took a problem from the curriculum document and modified it to be more "2012" (substituting iTunes downloads for CDs).

When the students were done, three of them came and shared their work with the class.  The group of teachers in the lesson study chose the three groups because each of them used a different strategy to solve the problem, and all the strategies were different and unique in their own way.  Here were the three strategies:
This group made two charts (one for each type of download) and then found combinations that met the requirement of 130 downloads.

This group chose to find the rate in each package for one download.  They they went about finding what would be the best package to get for the 130 downloads.  They also did a bit of cross checking to make sure that they were on the right track.

This group chose to make a graph to visually show their findings.  The first picture shows how they came to their conclusions, but this second picture shows the graph. 

Here is a picture of what the board looked like at the end of the lesson:


After the students left the classroom to go to drama, the teachers de-briefed the lesson talking about what they noticed and where they would go next.  The group noticed that while the class is very good at figuring out the rate, they need some reminders to actually write the whole rate down (e.g, 33 cents per download).  This is a simple thing that can be reinforced when Heather co-creates her success criteria with the class for this unit. 

The teachers also practiced giving some descriptive feedback to the students.  Here is what they said: