Friday, December 9, 2011

Three Part Lesson as Bansho

In Melissa's combined Grade 3/4 class her students are pretty comfortable in being mathematicians.  They are very aware of what the learning goals of their lessons are, how to use success criteria to improve their answers, and how to reflect on what their strengths and weakness are (mathematically speaking).

She attended a Grade 3 PD session with the program department the other day and loved the idea of seeing her three-part lesson as a Bansho.  So she grabbed some long kraft paper and got to work taking her three-part lesson from paper to wall and got the students thinking.

Her "Minds on" was having the students (in partners) decide what the data could represent.  After they had done this, she recorded some of their thoughts along each side of the specific graphs.  The students then came up with a prediction:  They thought all the data in the pictures was of the same thing, but represented in different ways. 


As her "Action" she asked the students to think of something that might be true of most of the students in the class, then conduct a survey to see if they were correct or not. 

For her "consolidation" she choose to do a congress where two different students shared their work with the class.  She photocopied this work and then put it up on the kraft paper where Melissa recorded the "Stars" (things that the group felt they did well on) and "Wishes" (things that the group felt they needed to improve upon).    They also created a highlights sheet to highlight what they learned (as a class) from the lesson.

Seeing their lesson as a Bansho allows the students to not only see the progression of their learning, but also refer to it when they are participating in the consolidation of the lesson.  Plus, in doing it on the kraft paper it allows you a chance to leave it up for a bit, then roll it up when you are done.  Only to bring it out again to help consolidate previous learning into new learning.

Learning Goals for a Rotary Teacher

Antonia teaches math on rotary.  She has a combined Grade 6/7 math class and also a Grade 8 math class.  She was a little unsure of how she was going to be able to display her learning goals for all three grades.  She knew that due to lack of space chart paper was not going to work in her classroom.  So she decided to use technology to help her.  Her school had previously done some planning so that both of her division (junior and intermediate) are doing the same expectations at the same time.  This really helps in working within two divisions.

She typed up all of her learning goals for the strand that she is teaching for each grade.  She used the specific expectations to help her create these learning goals.  She then posted them on the wall in her classroom for the students to see.  At the start of the lesson each day she now refers to the learning goals that they will be working on that day.  The students are aware of what they are learning, and are able to articulate specific things that they are struggling with.  A pro in having them up for the whole unit is that the students are able to see (in a nut shell) where they are going over the next few weeks.  (It is up to you how you want to display the learning goals - you can also do them a few at a time if that works better for your teaching style)

Here is what her wall looks like:

At the bottom of her learning goals she also has her success criteria.  This helps give the students one place to turn to when they are done their work and want to make sure that they not only understand what the goal of the lesson is, but also what is expected in their work.

Graphing In Kindergarten - YOU BET!

Casey teaches in a full day kindergarten class.  She had been at her daughter's school and saw a great idea for a bulletin board and decided to give it a try with her kindergarten class.  (I like to call that "educational shoplifting" :)

She asked her students the question of "How Many People Are in Your Family?"  Instead of having them complete the graph on chart paper, she gave each student a small paper plate.  On the plate they drew the people in their family.  By using the paper plate it allowed her the opportunity to keep the drawings all the same size.  This really made it easy for the students to compare the different sizes of their families as they were able to count the plates to help determine how many people are in each type of family.  (e.g, More students have 5 people in their family.  9 friends have 4 people in their family)  With 29 students it makes for a full bulletin board!

Moving Forward With Success Criteria

Kristen's combined Grade 5/6 has been working on graphing.  They have been looking at graphs and creating graphs on a variety of topics.  Kristen found that her students were struggling when physically creating a graph.  They are able to read a graph, and make assumptions and interpretations about the graph, but don't always pick the most appropriate graph for the data set they are working with.

To help them overcome this difficulty she created success criteria with all of the things she is looking for in a good graph.  On her success criteria you can see how she covers some of the "basics" of graphing (e.g., my graph has a title and labels) but also covers some of the application / communication aspects of graphing (e.g., I can explain why the graph I chose is the most appropriate, My scale is appropriate for the data I'm using because....)

Here is her success criteria for the unit:

It now makes things so much more clearer for the students, because they know what is expected in their work, and it also gives Kristen an anchor to draw some of her descriptive feedback from (e.g., The graph that you chose to represent the data works well as it makes the comparison between the two choices very clear.  How could you have used a different title to match your survey question a little bit better?)  Both of these things (the success criteria and the descriptive feedback) are going to really have a positive impact on student achievement.

Wednesday, December 7, 2011

Asking Questions About Graphs

Haroula's Grade 1 math class is near the end of their unit on graphing.  She wanted to give them a culminating task that would not only have them create a graph, but also create questions about the data in front of them.

Each student choose a question to ask their peers.  They then went around and surveyed each student in the class and recorded the answer in a tally.  She kept things pretty simple by suggesting that there be no more than four options (answers) to choose from.  The students then created a graph based on the data they collected.

Haroula then had the students exchange completed graphs.  The students then had to ask two questions based on the new graph in front of them. (On the yellow paper) The author of the graph then had to answer the question that was asked of them. (On the orange paper).  When the questions were asked and answered, she put the graphs and the questions on display for everyone to see.  She included a description of the activity (procedure) as well as the curriculum expectations that were covered in doing the activity.  It's great to see not only the completed graphs but also the questions that were asked about each graph.

The Finished Product

Close Up Of The Description Of The Activity.
 

Friday, December 2, 2011

Marker Students

We have all had to identify two marker students in our classroom.  One of our schools is taking the work of those marker students out of the binder and onto the walls.  They have turned a conference room into a living data wall.  Each teacher has posted the work of their marker students in all three area of reading, writing and math.  They have written down what they notice about the students strengths on the task, their needs and also the "next steps."  The "next steps" however are for next steps in the teaching of the topic, not the next steps for the student.  At every staff meeting they are going to be spending 10 minutes talking about what they notice about the work of the marker students, and what strategies they can share with each other to help not only the marker students improve, but all of the students in their class improve.

One side of the Room.  Each cartoon person represents a student.

The other side of the room.  You can see how each teacher has their two students and the 3 subjects.

A sample of a math problem from a student.  (The work is taken from The Process Standard Series by Susan O'Connell)

Here are the notes the teacher made about the student's work.  They can easily turn the strenghts and needs into effective Descriptive Feedback to the Student.

Tuesday, November 29, 2011

Learning Goals as a Guide

The Grade 2 afternoon PLC took a different approach to exploring about math.  Together they co-created learning goals for the Geometric Properties and Geometric Relationships expectations in the Geometry and Spatial Sense strand.  They then were able to dive into the resources that they had brought with them to find activities and lessons that would be useful to use when teaching those specific expecations.

Starting with the Learning Goals is really helpful before you teach a unit as it really helps you focus on curriculum expectations, but also help you organize all of the wonderful ideas that you have into speficic lessons.  Here are some samples of the ideas that they came up with.


Check around in your school for the Dr. Small books and the Van De Walle books.  They should be there.  If you don't have a copy of the Guide To Effective Instruction, you can download one (for free) at www.eworkshop.on.ca  Just click on "Guides To Effective Instruction" and go from there.

Graphic Organizers

The Grade 2 morning PLC decided to look at graphic organizers as a way to engage their students in the math.  They picked Geometry as the strand that they would use to work with the graphic organizers.  These organizers came from a series of books by Susan O'Connell called "The Process Standard Series, K-2"  There are 5 books in total for each grade band.  These come from the communication book.

This one is called an "Idea Pot."  You can put the main topic (strand) at the top and then have the students brainstorm all of the different things they know about this topic.  If students want to add to this pot as the unit goes on, then use a different colour to add new words to help you (and them) see how much they have grown since the start of the unit.

This Graphic Organizer is called "What I Know" or the Freyer Model.  In the centre the students pick (or are given) a word/shape/figure/etc.  They then define it, list characteristics of it, give examples of it and give non-examples of it.  As our group found out, it is sometimes hard to pick "Exciting" shapes because of the thinking that goes along with explaining it! (Right star group! :)


The last one is called "The Big Three."  It's a great way to have students synthesize what they have learned over a period of a few days, or a week.  You have them choose 3 things that they think are most important.  You can see here how our teachers choose the "Big Three" for 2D shapes, 3D figures and Symmetry.


Super Job Grade 2 teachers!  I can't wait to see these in use in your class for Geometry and beyond!

Wednesday, November 23, 2011

Critically Looking At Questions and Tests

The Grade 7 FOS PLC's used their time together today to look at the resources that we use, and then evaluate them on how effective they are.  We know that in our schools we have textbooks, ministry guides and supplemental activities, but there is not one "just right" resource.  So what do we do?

We started our session by looking at an activity sheet from one of the textbooks that are in our schools.
 Each teacher then looked at the questions (individually) and then we shared how we would mark each question.  When sharing, some people shared why they gave a question a specific mark (e.g., There were 4 things, so I gave 4 marks).


After doing this, we then used the achievement chart to decide what type of question each of the printed questions were.  It became very obvious to us that we had a lot of KU type questions and not a lot of communication type questions.  When we converted this into percent, it turned out that at least 40 - 50% of our questions were just KU.  We had some really good discussions which included things like:  If the question did.....or In my class they would..... - But, we were only taking things for face value - If it only shows Knowledge, then it only shows Knowledge.

After noticing what types of questions were on the sheet, we then turned to our curriculum to then have us see what expectations we were covering.  The questions that were not covered by the expectation were then crossed off. 


What we also discovered was that one of the 4 expectations found under Location and Movement in the GSS strand was not covered at all in this activity. 

The teachers then broke off into groups (1 group in the AM, 2 groups in the PM) and then picked one of the questions that was in the curriculum and then "opened it" up more.  This allowed us to have a really good question that focused on more than just one type of question - it was a question that could be used to help assess all four quadrants in the curriculum. 

The four categories at the bottom are what the teachers would be looking for when they mark each question.

Orange - Minds On,  Blue - Action, Green - Home


Wednesday, November 16, 2011

What a Graph Could Mean

Brian's Grade 6 class has been reviewing the "text features" of a graph.  They have also been talking about how graphs can be used to display data that represents a small group of people, or a large group of people.

His Minds On was getting his class to look at a graph (Via the ELMO) that had no "text features" on it.  They talked about what was missing and then gave examples of what they might be.  Brian recorded these things on an anchor chart to be used as their unit carries on.

For the Action part of the lesson, the students used the same graph, but came up with their own ideas as to what the graph could be about.  Some of them choose topics that were important to them (e.g., how much homework students got per grade) and others that were a little more worldly (e.g., the number of people in a union).  Once they came up with their topic, they then came up with all of the key elements of the graph (title, lables, key, scale, etc.) and also created 3 questions that could be asked of their graph.  One question was a true/false question, a second question was a multiple choice question (with 4 choices) and the final question was a more open question that could fall into a Level 3/level 4 range on a Q-Chart.

To consolidate the lesson Brian had the students look at all of their graphs and talk about what was similar and what was different.  They also talked about what questions were easy to make, and about what questions were hard to make.  They also talked about why the graph looked the way it did - and that it lent itself to going from smallest to biggest. 

The work on display with the expectations covered on the pink piece of paper.

Type of Job and Amount Paid

Number of Ice Cream Scoops Sold Per Day

Recycling Rates by Province

Popular Ice Cream Flavours At The School

Homework Given By Grade

Number of Employees Per Union

Graphing In Grade One

Ellen's Grade 1 class is starting their unit on Data Management.  She choose a lesson from the Guide to Effective Instruction as part of her unit.  Using the three-part lesson template she re-worked the lesson to meet the needs of her class.

For her Minds On she had the students complete a graph as a class about what their favourite type of recess snack was.  At the top of her graph she included a class list.  She used this class list as a way to show her students how to keep track of who had already given their answer.  She also drew a picture beside the different choices to help her students use a picture to help them figure out what the word was.  Once all of the names were crossed off, the students then started sharing what they noticed about their graph.  You can see the nuggets of what they discovered written right on the graph.


For the Action part of the lesson the students brainstormed several questions that they could ask each other about what their favourite things could be.  The questions were recorded in one colour and the possible categories (or answers) were recorded in another colour.  The students then went to work choosing their question from this list or from their own idea, and then began surveying their friends.
The students were each given a copy of the graph template and a clipboard.  On the back of the sheet, Ellen photocopied a class list so all the students needed to do was to flip over the sheet and cross off the name of their friend who they had just asked.  This was an easy way to keep track of who had and who hadn't answered the survey.
For students who struggle with printing, or were not comfortable in writing out their choices (it is early Grade 1) they drew a picture of their choice and then went on their merry way surveying their classmates.
In the final part (consolidation) of the lesson the students shared their graphs and then asked each other questions about what the data they collected said.

Kindergarten Science and Math Connection

In Adrienne's kindergarten class they have been learning a great deal about seeds and what they do for plants and humans.  It is the basis of the classroom inquiry project that her children have been exploring about.  As they move through this inquiry, they are also beginning to learn about graphing and sorting as they are covering Data Management right now.  

At one of her centres Adrienne created a t-chart with two headings "Seeds" and "No Seeds"  Using flyers from local grocery stores the children cut out different objects and place them under the correct heading.  Not only were they sorting objects into two groups they were deepening their knowledge about what things have seeds and what don't and also working on their fine motor skills by cutting.

Graph Mats

In the primary grades, sorting is such an important part of not only Data Management but Patterning as well.  How do we help our young learners become better sorters?  Why not give them a sorting mat!  These sorting mats were finds from the local dollar store.  In addition to the plastic that they sit on, I also purchased black electrical tape to make the actual lines on the mat.  The mats are hard plastic and are about 11x17.  If your dollar store does not have them, then you can use cookie sheets or a large plastic tray.  For a large size of any of the mats use coloured duct tape and plastic shower curtains (also from the dollar store) for mats that are big enough for the children to stand on.

For sorting items into two groups.

For sorting or graphing items into 4 groups.

The classic T-chart.

For sorting items into three groups.

Monday, November 14, 2011

Great Glyphs!

 Glyphs are a fun activity that you can do as part of your Data Management strand.  A glyph is a set of directions that a student follows which is based on their own answers (or data).  At the end of the questions there is a product (a coloured in picture, a piece of artwork) that represents the answers (or data).  Below is a Glyph that was done at our recent Kindergarten PLC.  (For templates or links to the Glyphs visit the wiki).  We created our glyphs using only paper and pencil crayons, but they look MUCH better when you see them done in construction paper.
Our gylph asked us questions which made a pizza.

We displayed our finished work around the glyph.


After the gylphs are completed you can hang them proudly in front of your classroom (along with the instructions on how to make the Glyph) and then pose questions to your school community.  These questions could be:  How many boys are there in our class?  Most of the students in our class are what age?  What is the favourite pizza place in our school?  You can post chart paper up under the questions for people to answer, and also leave a spot for them to pose questions of their own.  A very fun activity to both do and include your school community into.  You can also google "Glyphs for Math" to help you get a lot of other good ideas for making Glyphs.

Baggie Games For Fun

Haroula teaches a combined Grade 1/2.  Her and her teaching partner switch off so they are able to teach a straight grade in math.  This leaves her with just the Grade 1 students.  As we know, Grade 1 students are active little beings who need to move around and need to be able to have some one-on-one time with the teacher to not only express their answers orally, but also to help them gain a better understanding of the concepts that they are being taught.

Haroula made up several different "Baggie Games" for her students to use as part of their math centres, and also for when they were "done" their work.  She finds that letting them use the games as part of her math program has helped her to get some of that much needed one-on-one time, while still reinforcing the concepts she is teaching (or has taught) in the large group.

One of the games that she has created is using Dot Cards.  She used the pictures of the Dot Cards from the Guide To Effective Instruction in Mathematics:  Number Sense and Numeration (GTEI)and then cut the pictures out.  She then taped them onto blank playing cards.  She has the students play a matching game where they have to match the same numbers together.  This helps them work on subatizing and also one-to-one correspondence.
You can see the two different ways to make a dot arrangement to show the number 6.

Here are some of the pictures of the other cards.

A second game that she made was originally in the GTEI but in the Grade 2 section.  She modified it to meet the needs of her Grade 1 students.  She also included a number line as a tool to help them not only get more comfortable with counting backwards, but also just in using the tool.
Here are the instructions she included.  (She has played the game several times in the large group and in small groups)

Here is everything that is in the baggie.

The cards are in a different colour of card stock to help make them stand out.
These games (and others like them) would be a great addition to any math program.  You could also use them as part of a family math night, and also as part of a "Math Bag" program where you would send home games for students to play at home.


Monday, October 31, 2011

After the Diagnostic, Starting The Decimal Unit

Kristen began her teaching of decimals with her Grade 5/6 class by using a problem that is based on one from Making Math Meaningful by Dr. Marian Small.  (MMM, p.160, Activity 8.1).  In MMM the problem is about estimating using whole numbers, and in this case Kristen changed the problem to involve decimal numbers to hundredths and thousandths. 

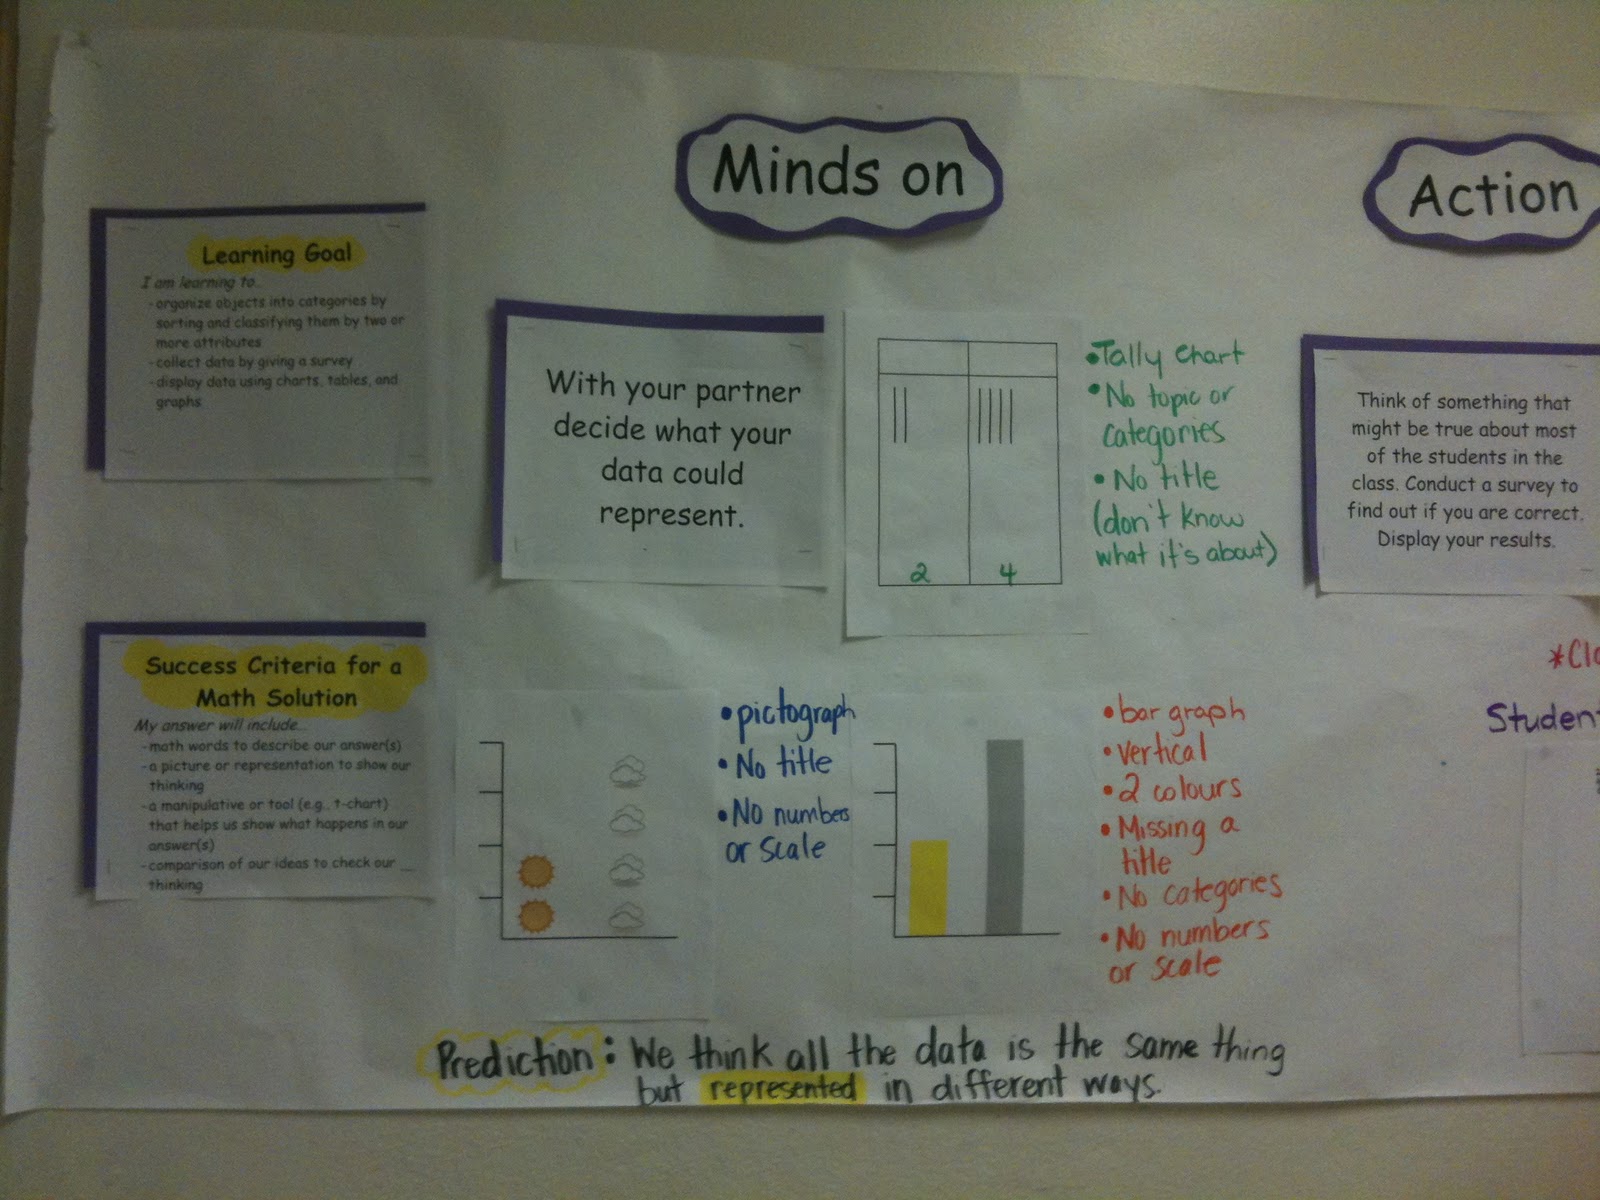
The lesson was set up in Three-Part Lesson format.  Here is the lesson template:

The Minds On focused on having the students order numbers.  She chose to do this to get the students thinking about how decimals can use the same numbers, but mean different things.  We had thought that perhaps some of the students may choose to use ordering as a strategy for solving the problem, but it was not one that we saw.

The action was this problem:  (You can see the minds on at the bottom of the page...It is an Eco-school after all!)

The students also completed a K-W-C as a class to help them flush out the information that was in the problem.

What was great about doing this was that the students got a chance to ask questions that were important to them.  There was some great discussion as to if the animals could only go in 2s or if they could go in groups of 3 or 4 (the answer was yes - but they could NOT go alone).  As well, one student touched upon the fact that the question was asking you to not only solve the problem, but EXPLAIN how you got your answer.  The second step that many students (and teachers) forget to do when solving a problem.

The students quickly got to work in pre-assigned pairs (based on optimal mis-match).  They used markers (no pencil's allowed) and didn't use our "banned" black and yellow (Yellow because you can't see it that well when your work is presented, and no black because that becomes our class editing pen). 

When the students were done their markers were collected.  Kristen really wanted to use the consolidation part of her lesson to help the students make sure that they were giving a really good / Level 3 answer.  So she asked the students the simple question of "What makes a really good answer?"  Using examples from their own work, the students then shared what they thought made a really good answer and why.  These thoughts were recorded on a large piece of chart paper:

The students now have an anchor that they co-created and that makes sense to them.  From it, informal success criteria was created about what makes a good answer.  A follow up lesson to this will be actually putting that success criteria on paper.

The students now were asked to add something that they thought was missing from their work.  They did this in pencil so Kristen could see what the improvement was.  (Hence why the markers were collected earlier on).  This was their independent practice.  They handed in their "updated" work and Kristen went to work providing descriptive feedback to them. 

Since we co-taught this lesson, Kristen was able to record what the students were saying about what made a good lesson as I was putting it down on the chart paper.  The student's focused on 5 different things.  To help her keep track of what the descriptive feedback she was giving to the students she numbered each item in the success criteria from 1-5.  As she gave each pair the descriptive feedback, she then recorded what she had given them feedback on, and what else she noticed that they need to work on.  Here is an example of how she recorded this information:

The first number is what she commented on, and the second or third numbers are what they still need more support in.  Its helpful to keep track of what you are saying to the student because if you notice that you are always writing the same thing, then they are not using the descriptive feedback that you are giving them and putting it into practice.

Here are the student samples showing not only their original answer, but their pencil additions and our black "editing" that matches the descriptive feedback that was given:


Start to finish, this entire lesson (Minds on, Action, Consolidation, Independent Work) took about 65 minutes.  All of the students were engaged, and all were participating in our class discussions.