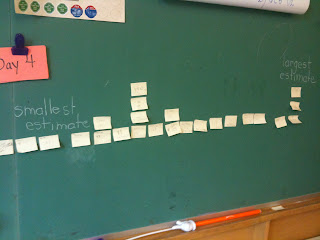
At the start of September Jay-Ellen had her class create a graph on what month their birthday was in. Each student put their name and date on a mini-post it note and then lined it up above their birthday month. They hung this graph up in the classroom for all to see.
A few weeks later she decided to use a jar that she had called "Estimation Station" and have her students estimate how many jelly beans they thought were in the jar. Here is what the jar looked like:
They collected their estimations on mini post it notes. When they were done doing their estimates, they then noticed they had a lot of post-it notes and needed a way to organize them. They thought back to their graph and wondered if they could use a similar strategy to order their estimation from least to greatest. What became tricky, and involved them using application skills, was when they had multiple estimates of the same number. Jay-Ellen guided them to look at their graph and then see what they did when more than one person had a birthday in a month. They knew that they could stack the numbers on top of each other.
A great way to not only compare and order whole numbers, but also to get some estimation and graphing in as well.


No comments:
Post a Comment